How to use Cappasity.AI analytics
Average time spent on each angle and product heatmap
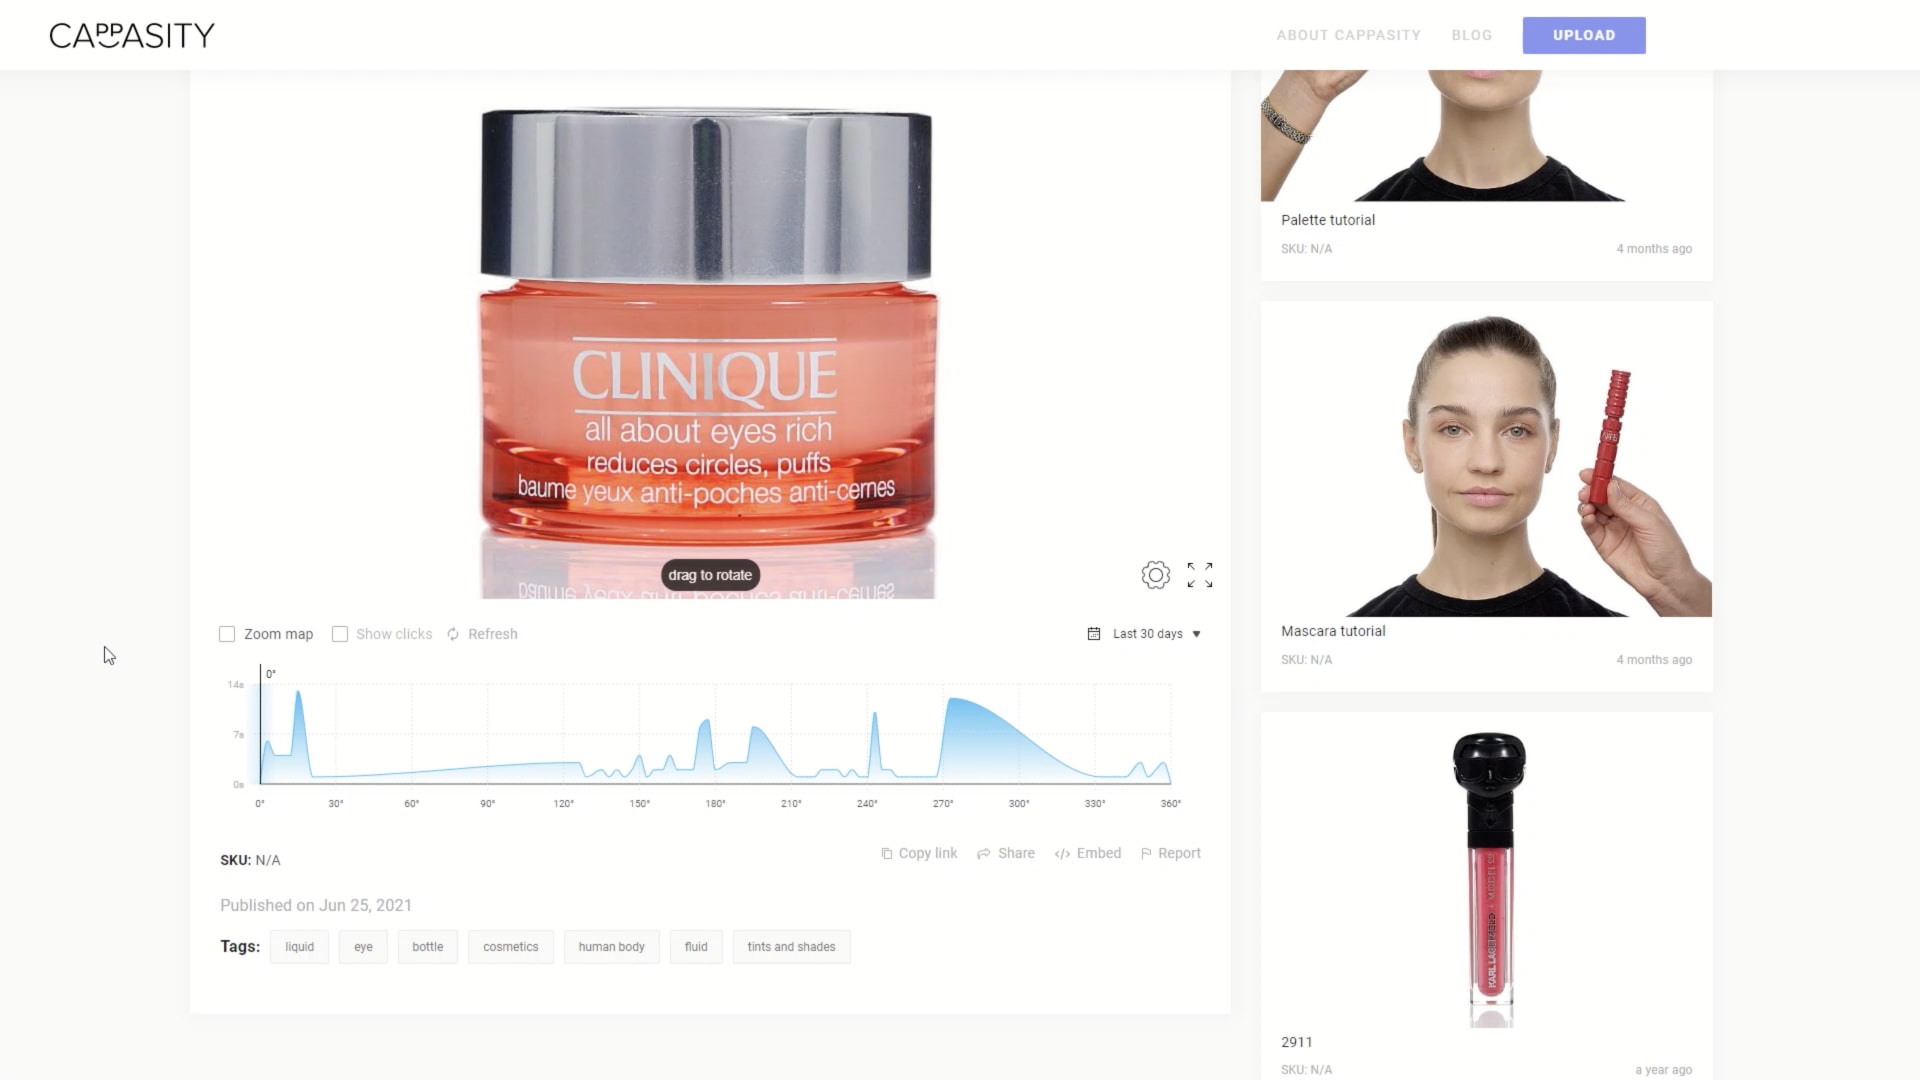
Step 1:
Go to the 3D View page.
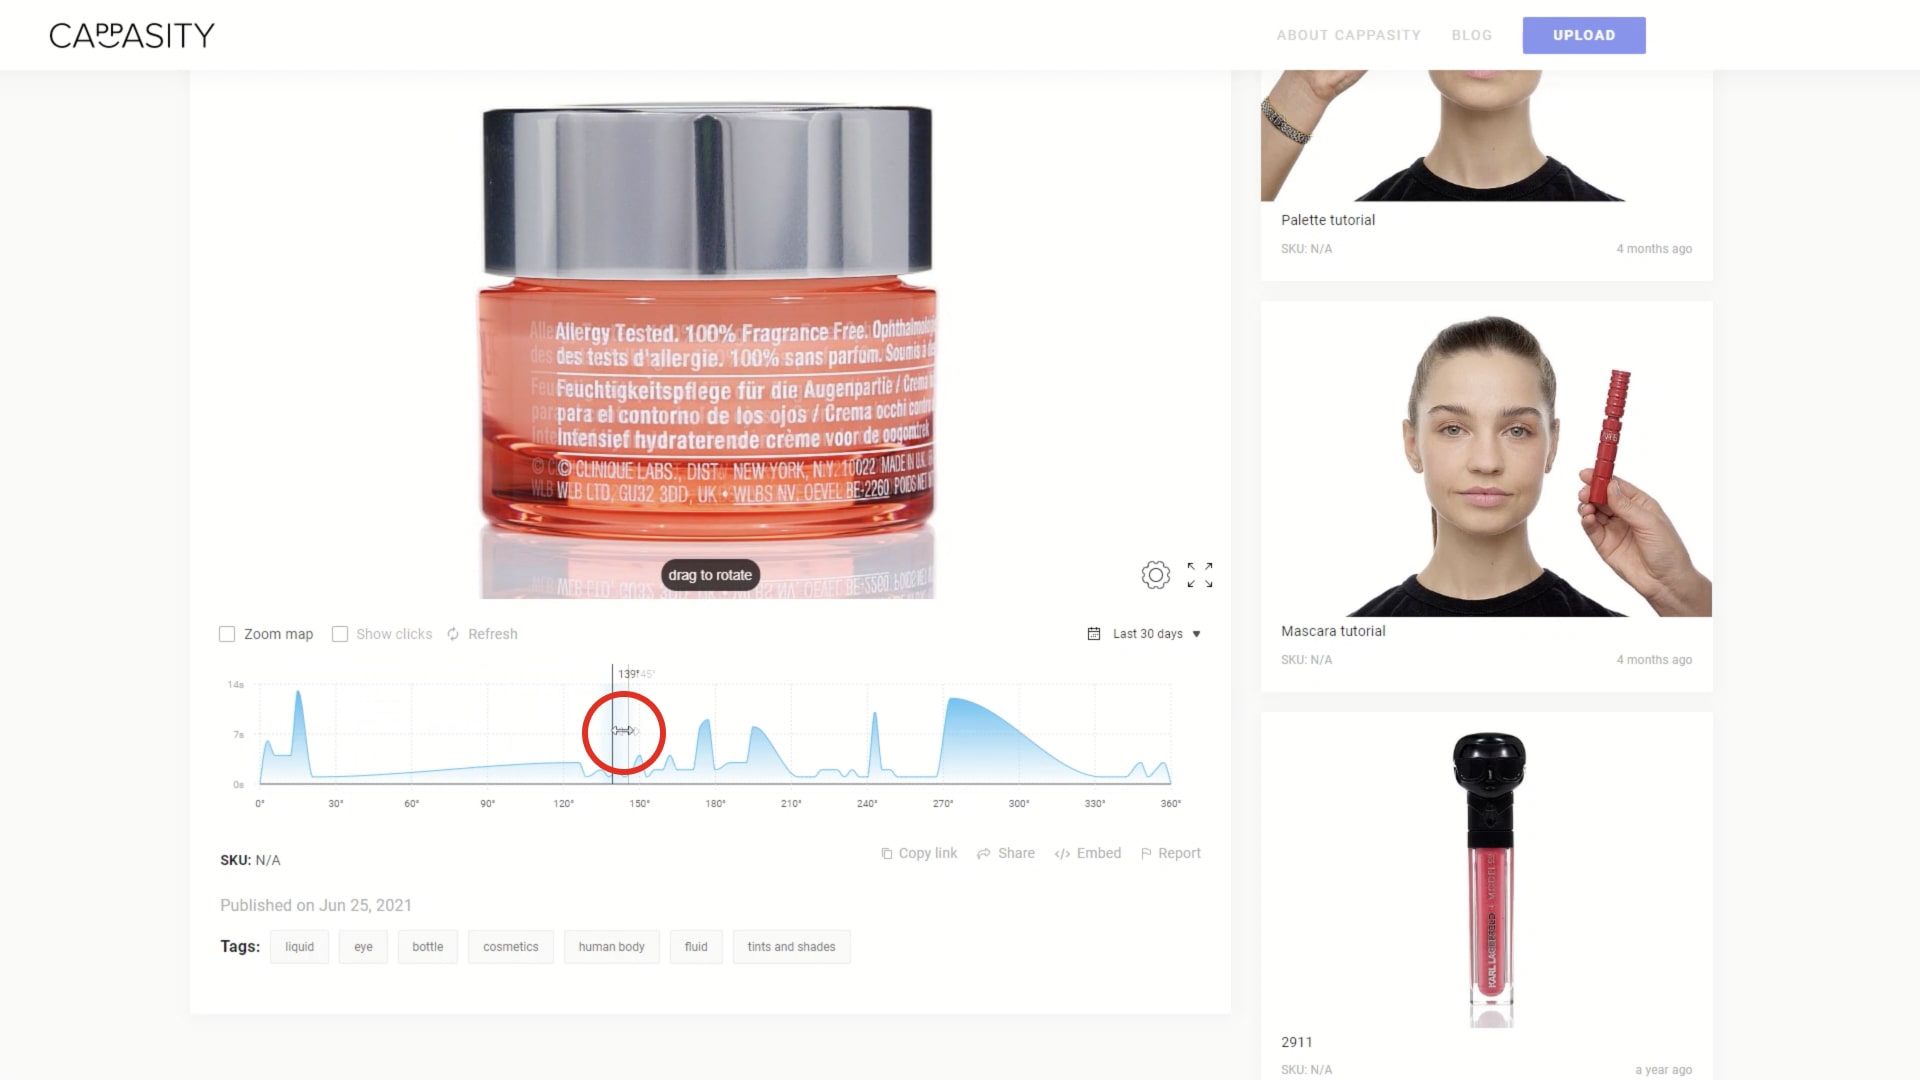
Step 2:
Check the product angles and related times.
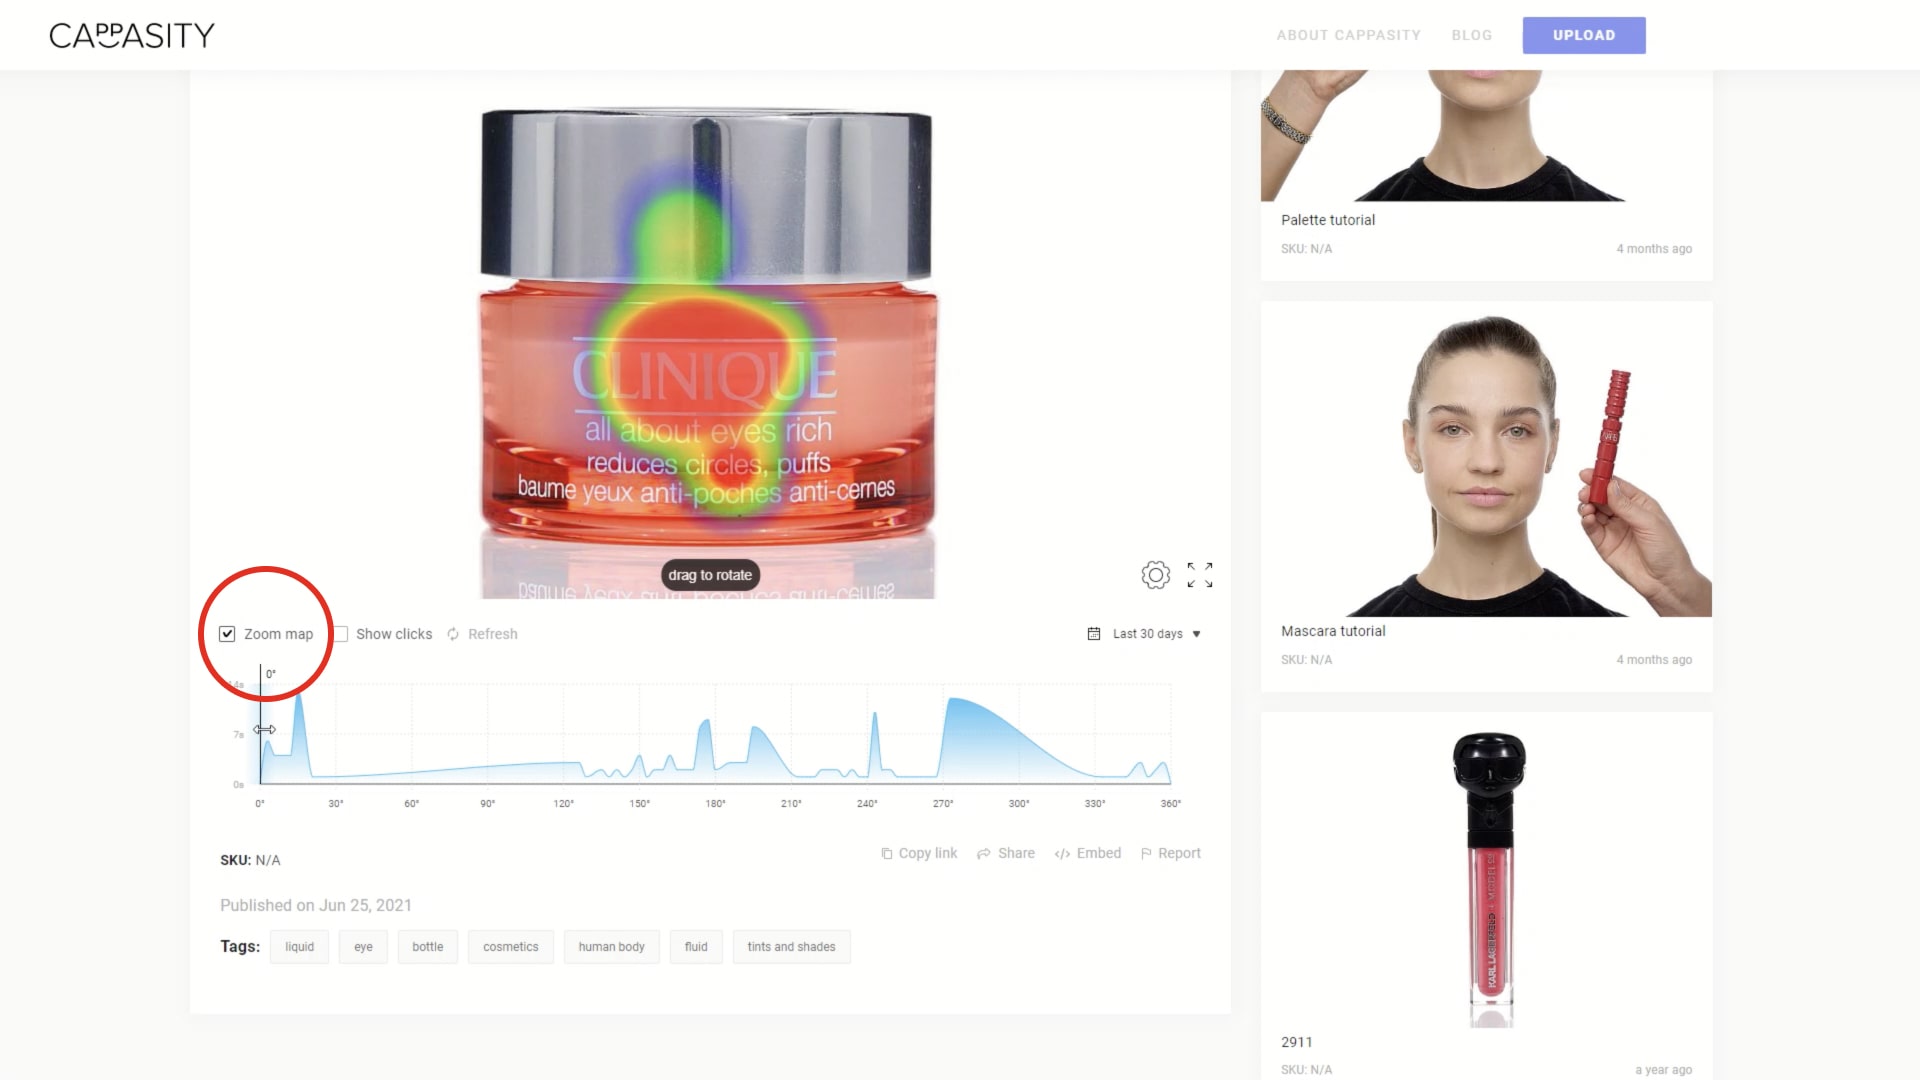
Step 3:
Tick “Zoom map” to see the product heatmap, showing which angles of the product your customers zoomed in on most often.
Tip: the heatmap identifies the areas of consumer interest.
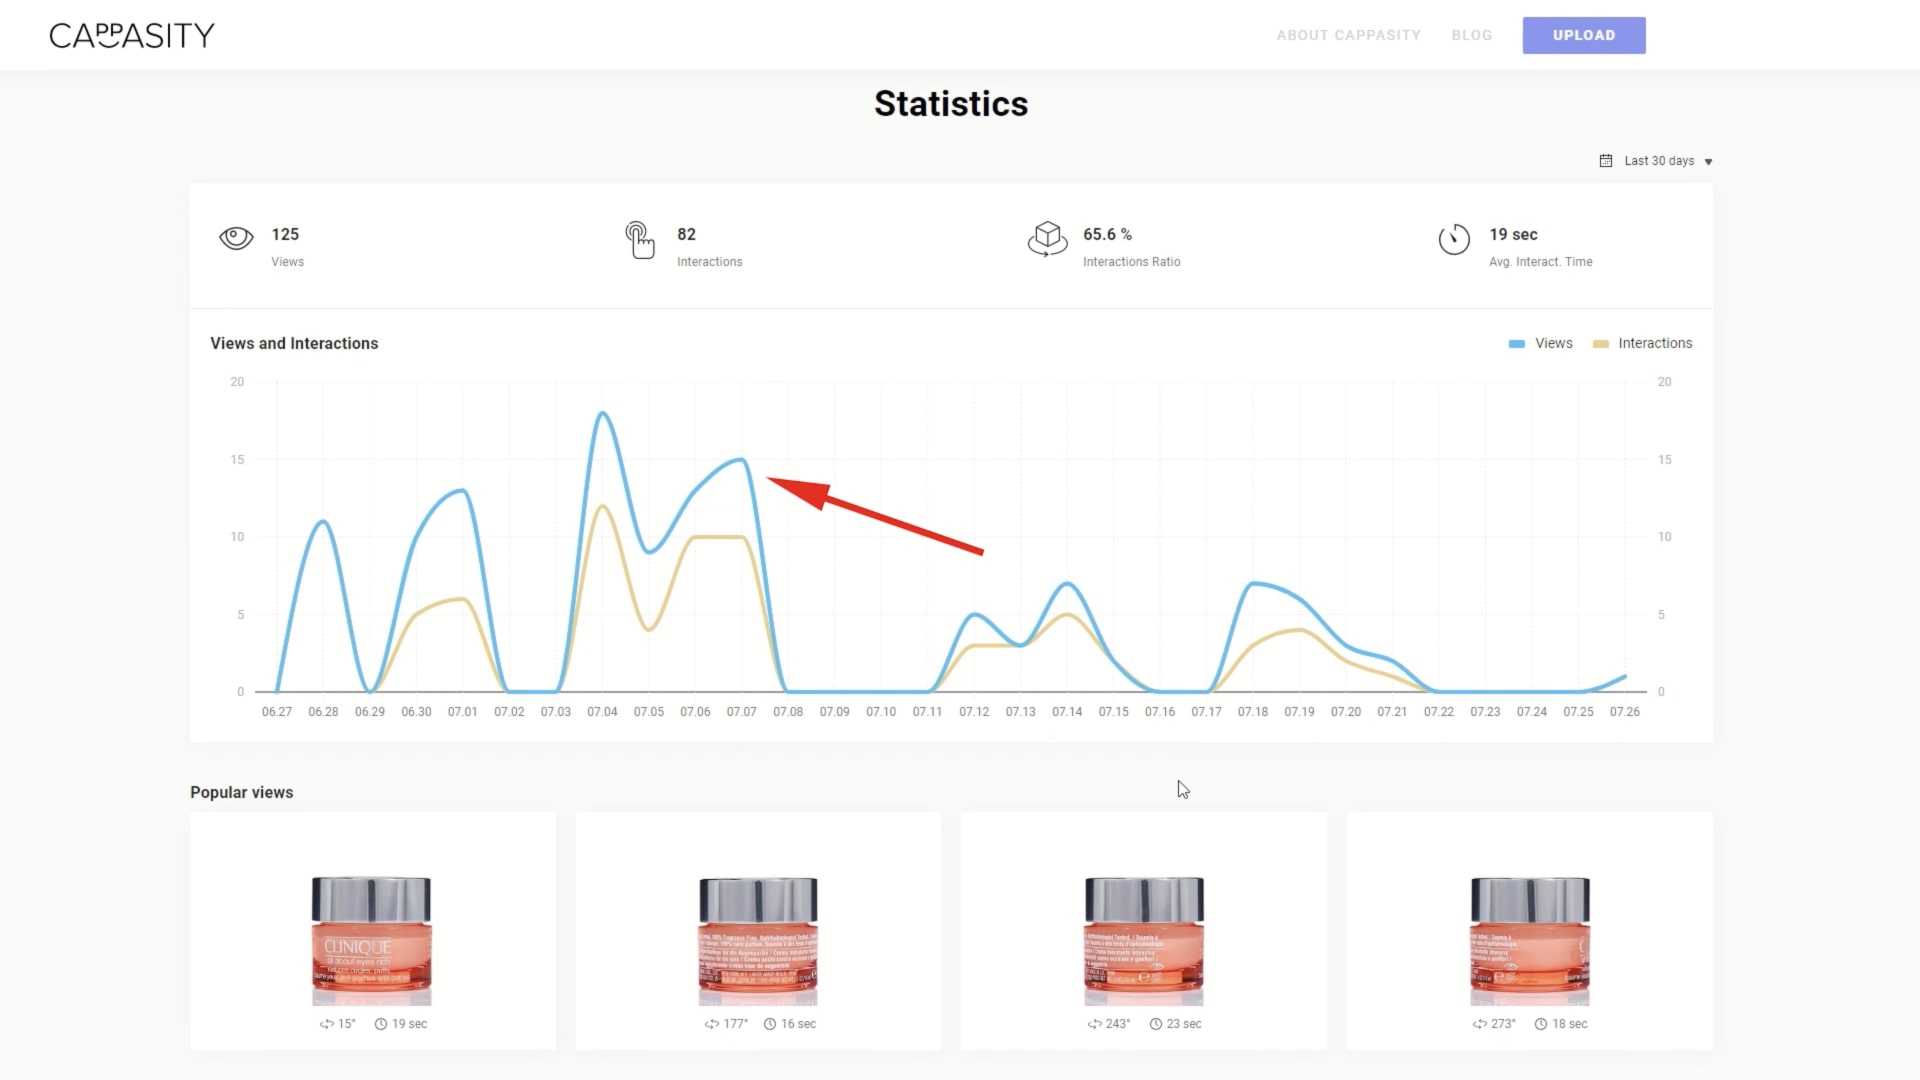
Detailed information about views and interactions
Step 1:
Views: Shows how many times the 3D visualization was viewed for a selected time period.
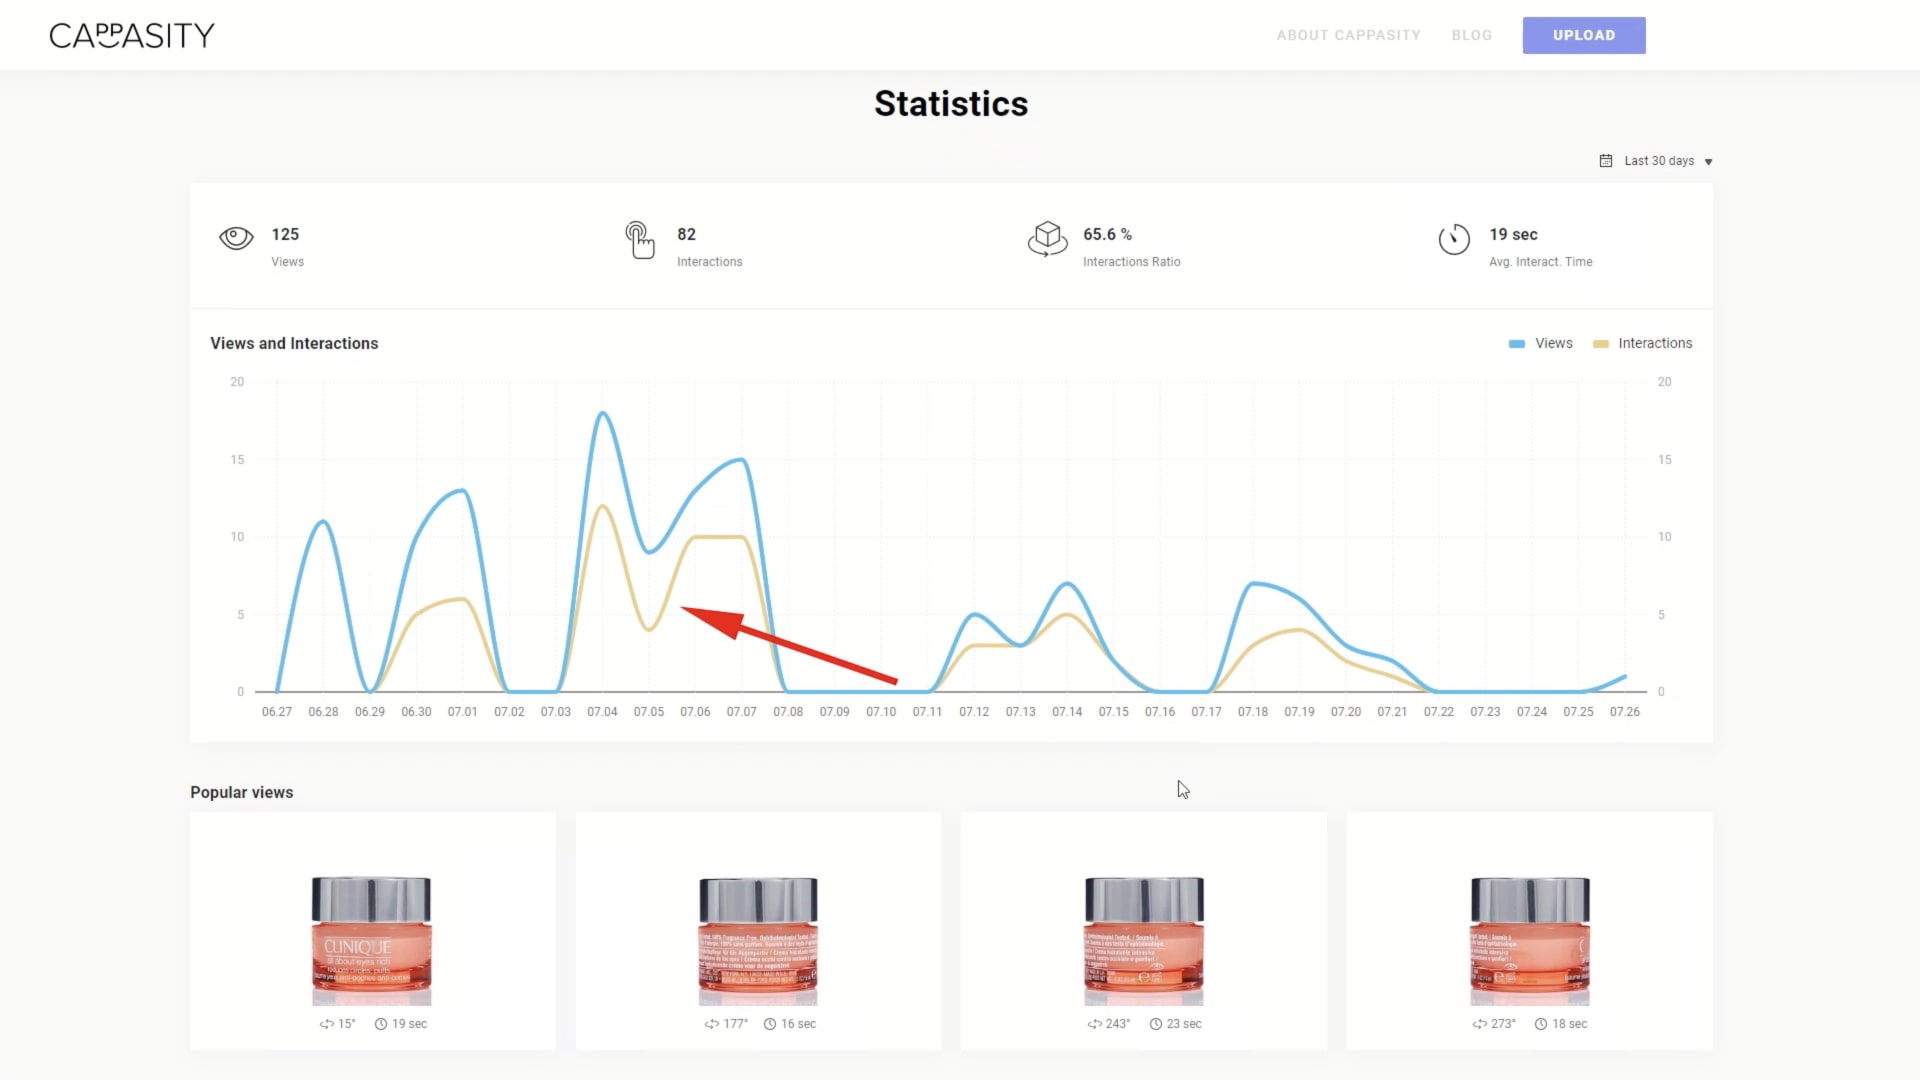
Step 2:
Interactions: Shows the number of interactions with the 3D View.
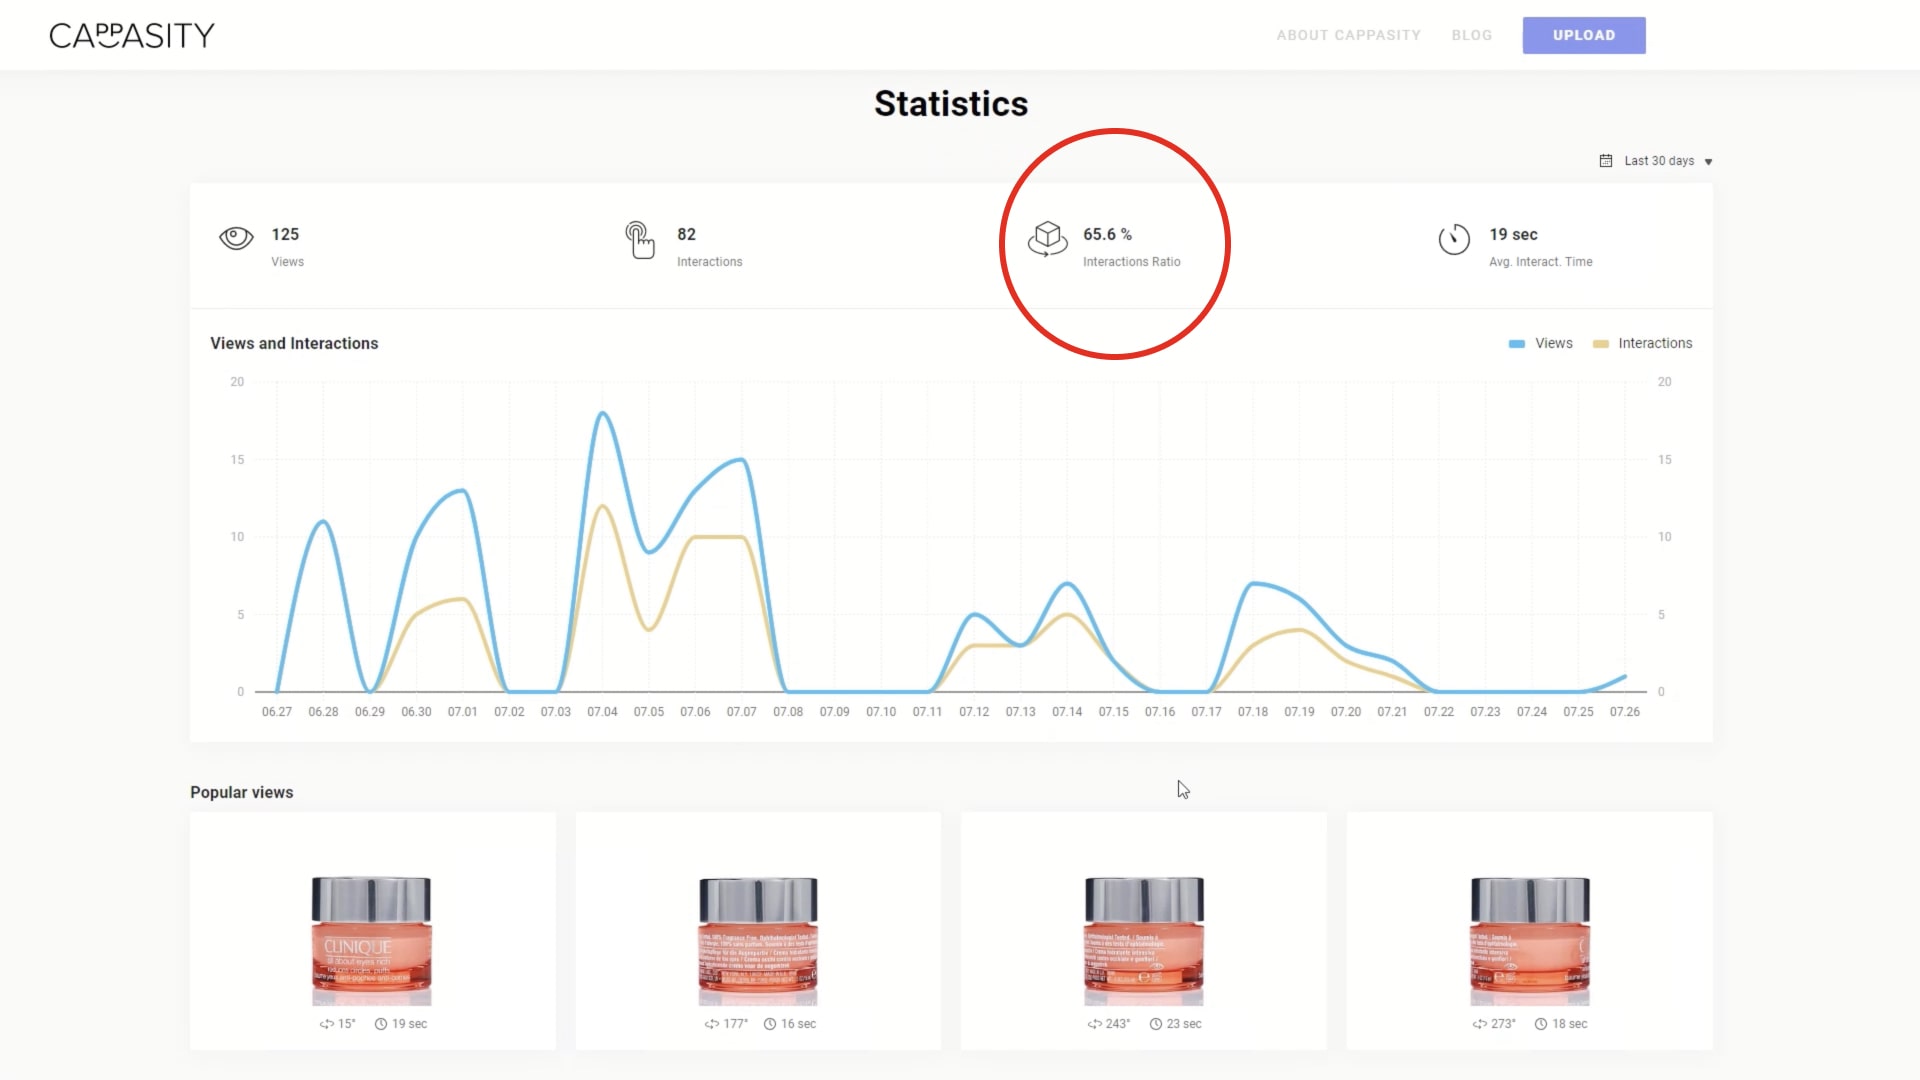
Step 3:
Interactions Ratio: Shows the percentage of users who interacted with the 3D View after viewing it for a selected time period.
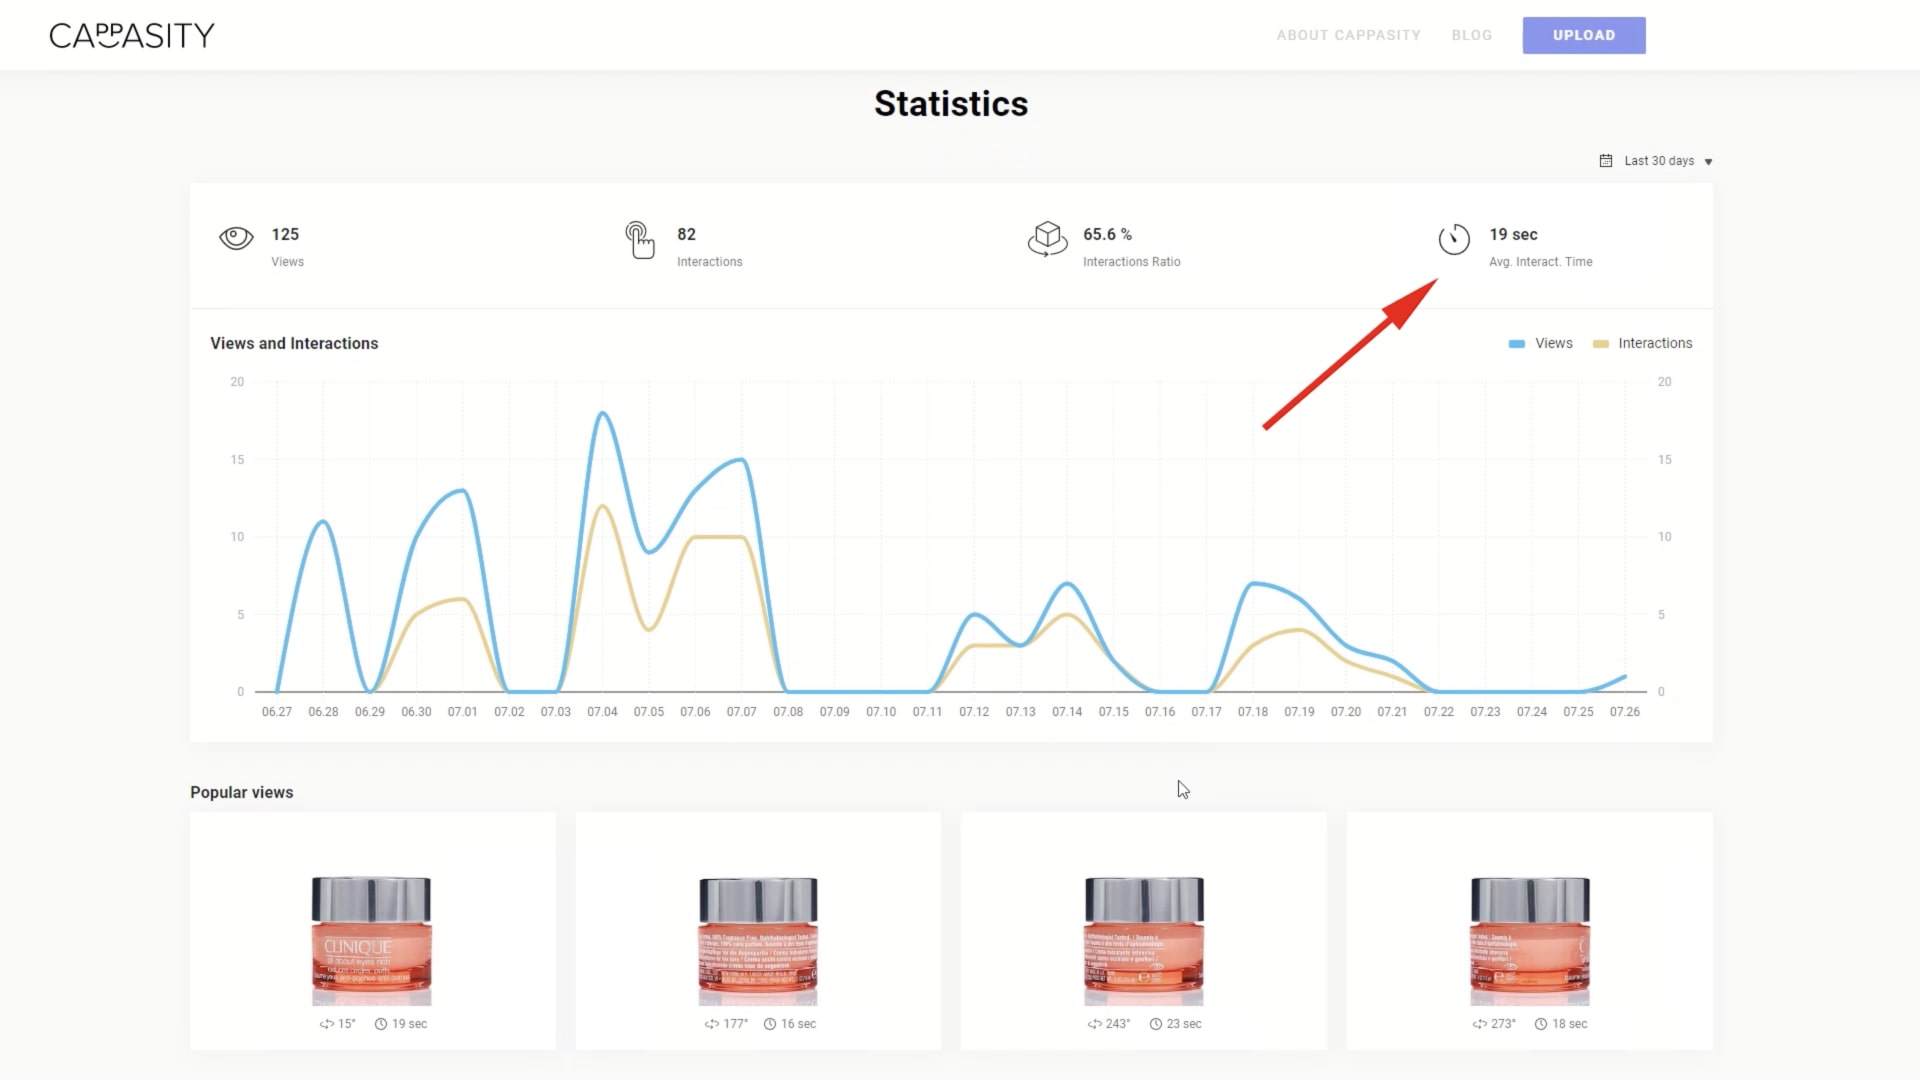
Step 4:
Avg. Interact. Time: Helps you measure customer engagement.
The most popular angles and most zoomed-in-on details
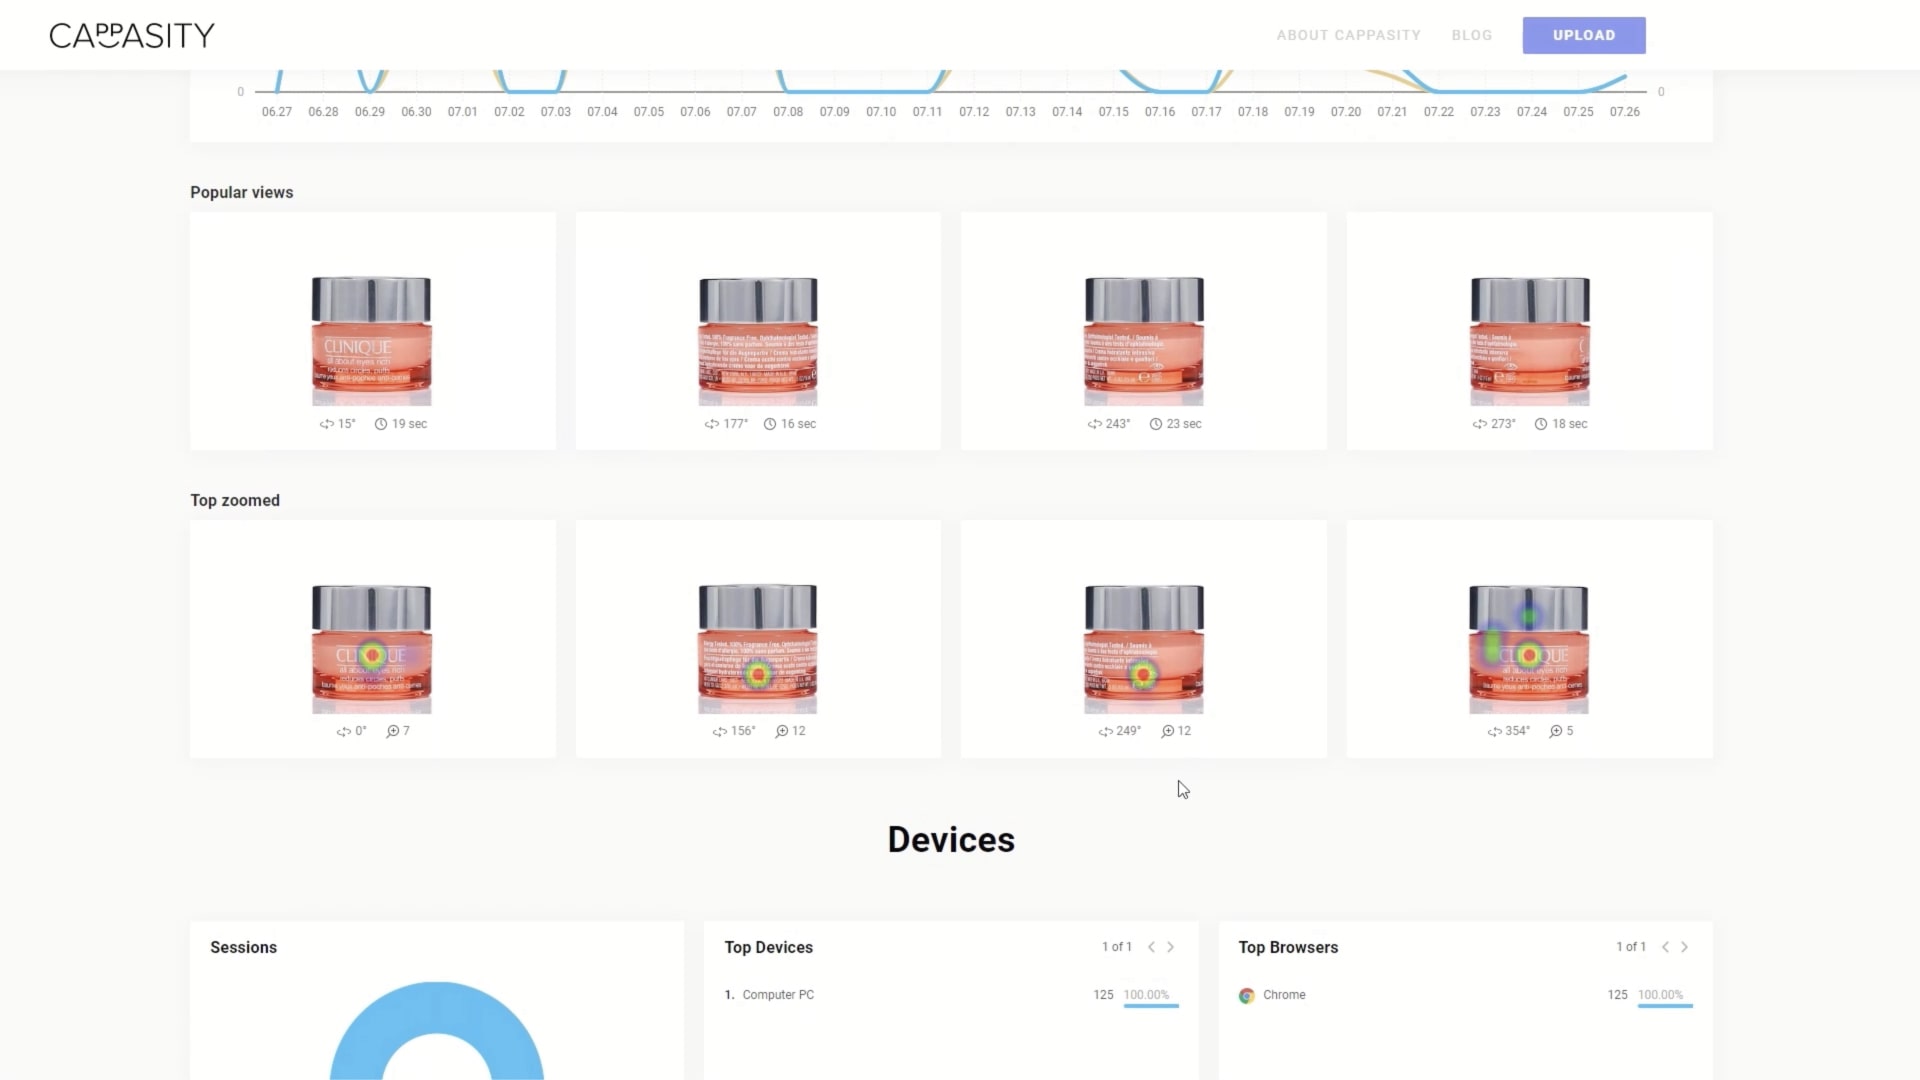
Here you can see which angles of the item your customers viewed for longer and which angles they zoomed in on most often.